


ANALYTICAL REVIEW OF THE PRESIDENT OF THE WORLD ORGANIZATION FOR SCIENTIFIC COOPERATION, CHAIRMAN OF THE INITIATIVE COMMITTEE OF THE ASIAN ACADEMY OF SCIENCES, PROFESSOR KHALILOV ELCHIN NUSRAT OGLU, THE "HIGHEST CATEGORY CHINESE NATIONALL TALENT"

(All statistical data on Intellectual Property Protection Indicators were taken from the WIPO Report “World Intellectual Property Indicators 2023")
One of the main tasks of the AASc is a civil initiative to initiate the creation of the Asian Intellectual Property Organization (AIPO) and the Asian Patent Office (APO).
These structures provide for the issuance of "Unified Asian Patents" and other security documents for all types of intellectual property operating in Asian countries that are members of the AIPO.
Since the third millennium, there has been a global intellectual leap in all Asian countries, of which China is the undisputed leader. This became especially noticeable after 2010, when China began to significantly outpace all developed countries of the world. This is evidenced primarily by the statistical indicators of applications filed and patents obtained for all types of intellectual property.
China has become an infectious and excellent example for all Asian countries and the locomotive of the Great Scientific and Technological Revolution in Asia, in which other countries were actively involved.
The table below shows the number of applications submitted for intellectual property.
Table 1.
Patents | 2021 | 2022 | Growth rate (%) | Share of world total (%) |
Applications worldwide | 3,400,500 | 3,457,400 | 1.7 | 100.0 |
China | 1,585,663 | 1,619,268 | 2.1 | 46.8 |
US | 591,473 | 594,340 | 0.5 | 17.2 |
Japan | 289,200 | 289,530 | 0.1 | 8.4 |
|
|
|
|
|
Utility models |
|
|
|
|
Applications worldwide | 2,924,420 | 3,010,510 | 2.9 | 100.0 |
China | 2,852,219 | 2,950,653 | 3.5 | 98.0 |
Germany | 10,576 | 9,469 | –10.5 | 0.3 |
Russian Federation | 9,079 | 8,521 | –6.1 | 0.3 |
|
|
|
|
|
Trademarks |
|
|
|
|
Application class counts worldwide | 18,182,300 | 15,543,300 | –14.5 | 100.0 |
China | 9,454,735 | 7,513,504 | –20.5 | 48.3 |
US | 899,499 | 767,375 | –14.7 | 4.9 |
India | 488,459 | 500,305 | 2.4 | 3.2 |
Industrial designs |
|
|
|
|
Application design counts worldwide | 1,513,800 | 1,482,600 | –2.1 | 100.0 |
China | 805,710 | 798,112 | –0.9 | 53.8 |
EUIPO (EU office) | 117,049 | 109,132 | –6.8 | 7.4 |
Türkiye | 65,924 | 84,111 | 27.6 | 5.7 |
Plant varieties |
|
|
|
|
Applications worldwide | 25,200 | 27,260 | 8.2 | 100.0 |
China | 11,195 | 13,027 | 16.4 | 47.8 |
Community Plant Variety Office (EU) | 3,480 | 3,193 | –8.2 | 11.7 |
UK | 409 | 1,702 | 316.1 | 6.2 |
As can be seen from the table above, China is significantly ahead of all countries in all indicators of intellectual property protection. Below is a graph reflecting the trend of patent applications filed in four countries and the European Patent Organization, which includes 38 European countries.
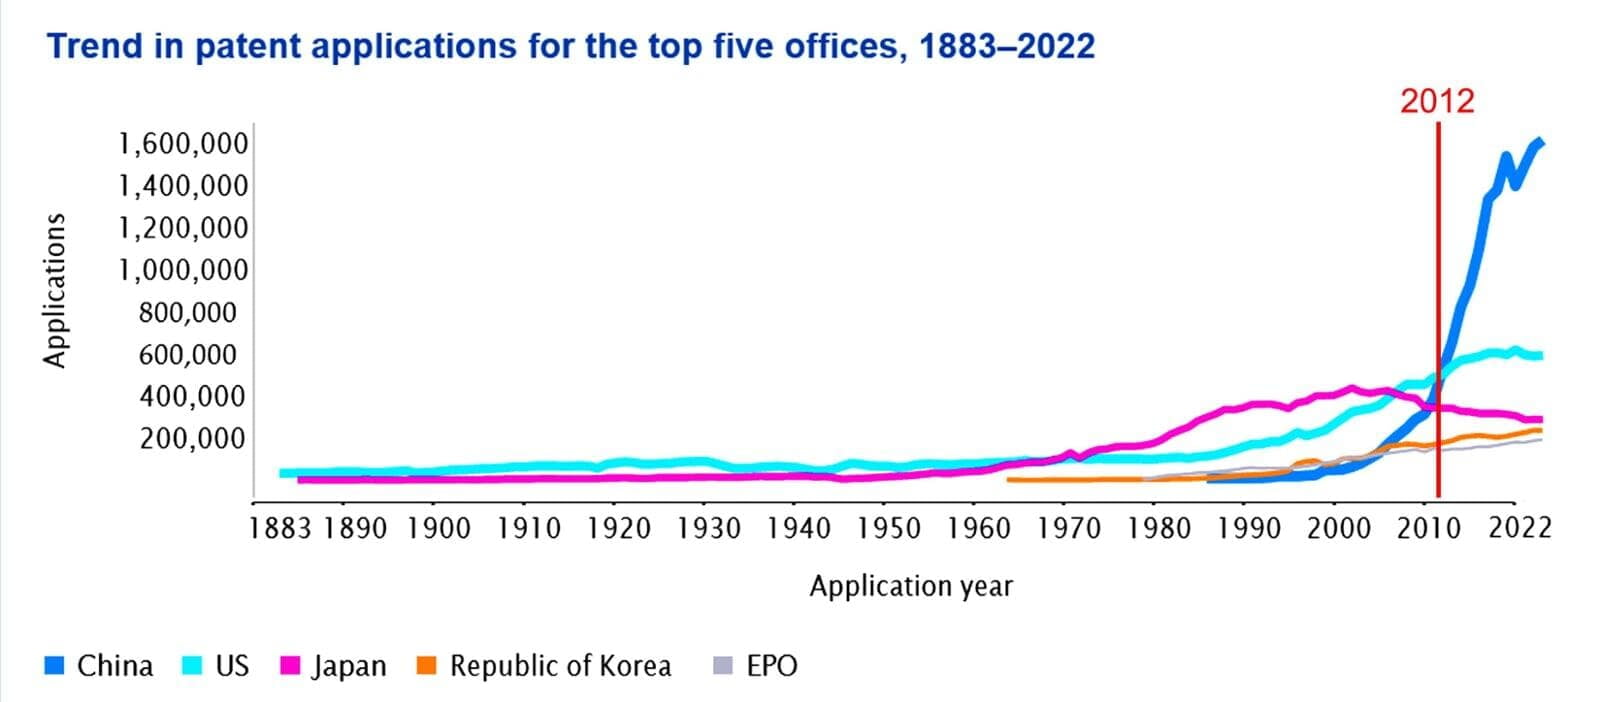
Fig.1.
Analyzing the graph Fig.1. We see that since 2012, the trend of patent applications filed has been growing sharply, in fact, exponentially.
In Fig.2. Diagrams showing the distribution of patent applications by region of the world in 2012 and in 2022 are shown. We see that the largest increase in patent applications was in Asia, which amounted to 68%, that is, it increased by 12% over 10 years, and more than 90% of this number of applications from Asian countries relate to China.
You can edit text on your website by double clicking on a text box on your website. Alternatively, when you select a text box a settings menu will appear. your website by double clicking on a text box on your website. Alternatively, when you select a text box
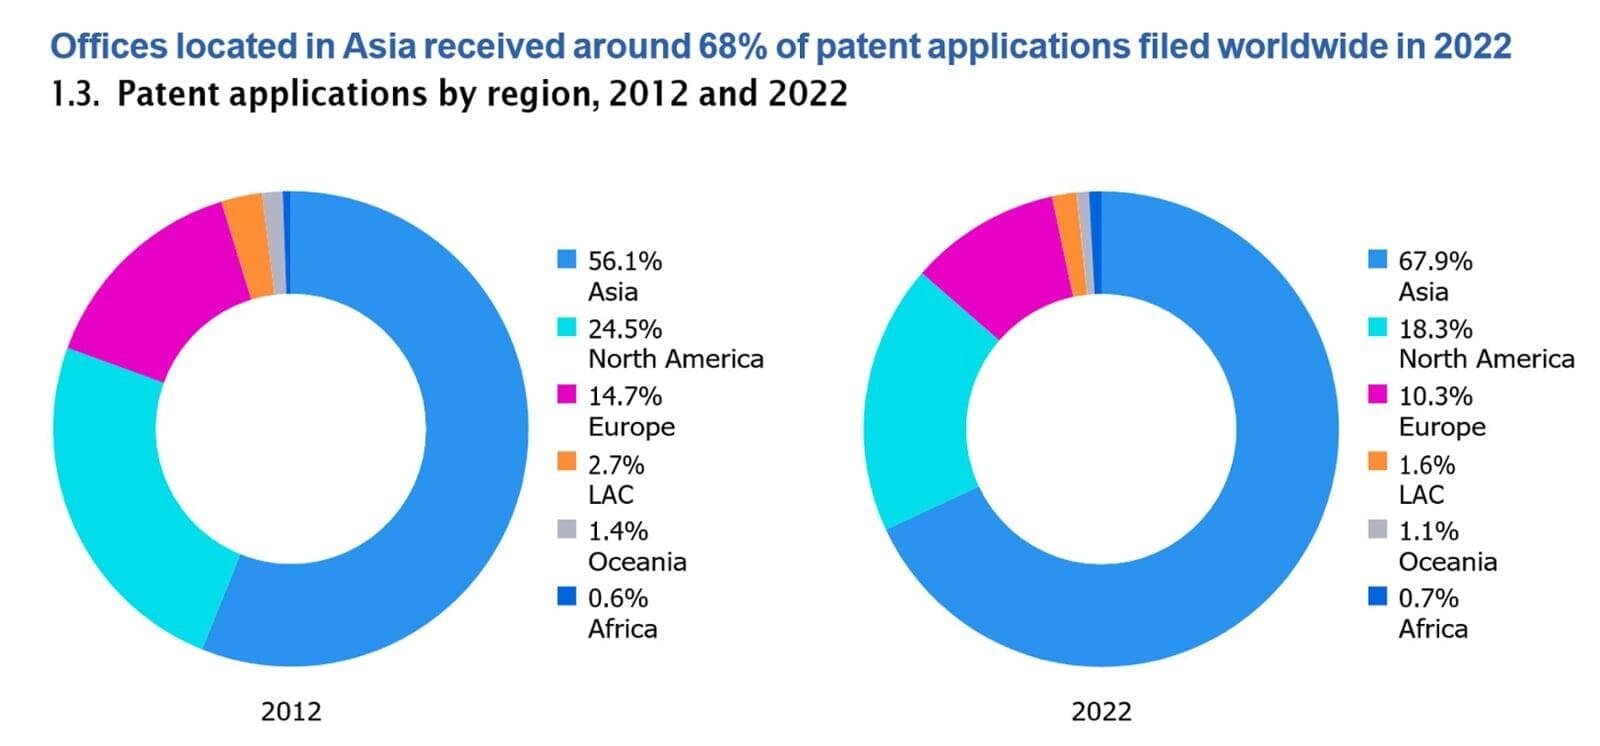
Fig.2.
Analyzing the events that could affect such an increase in China's patent activity since 2012, we come to the conclusion that such an event is the election of Xi Jinping as General Secretary of the Central Committee of the Communist Party of China at the XVIII Congress of the Communist Party of China on November 15, 2012. The new concept of China's economic, scientific and technological development put forward by Xi Jinping at the 18th Congress of the Communist Party of China led to a leap in the development of science, education and technology.
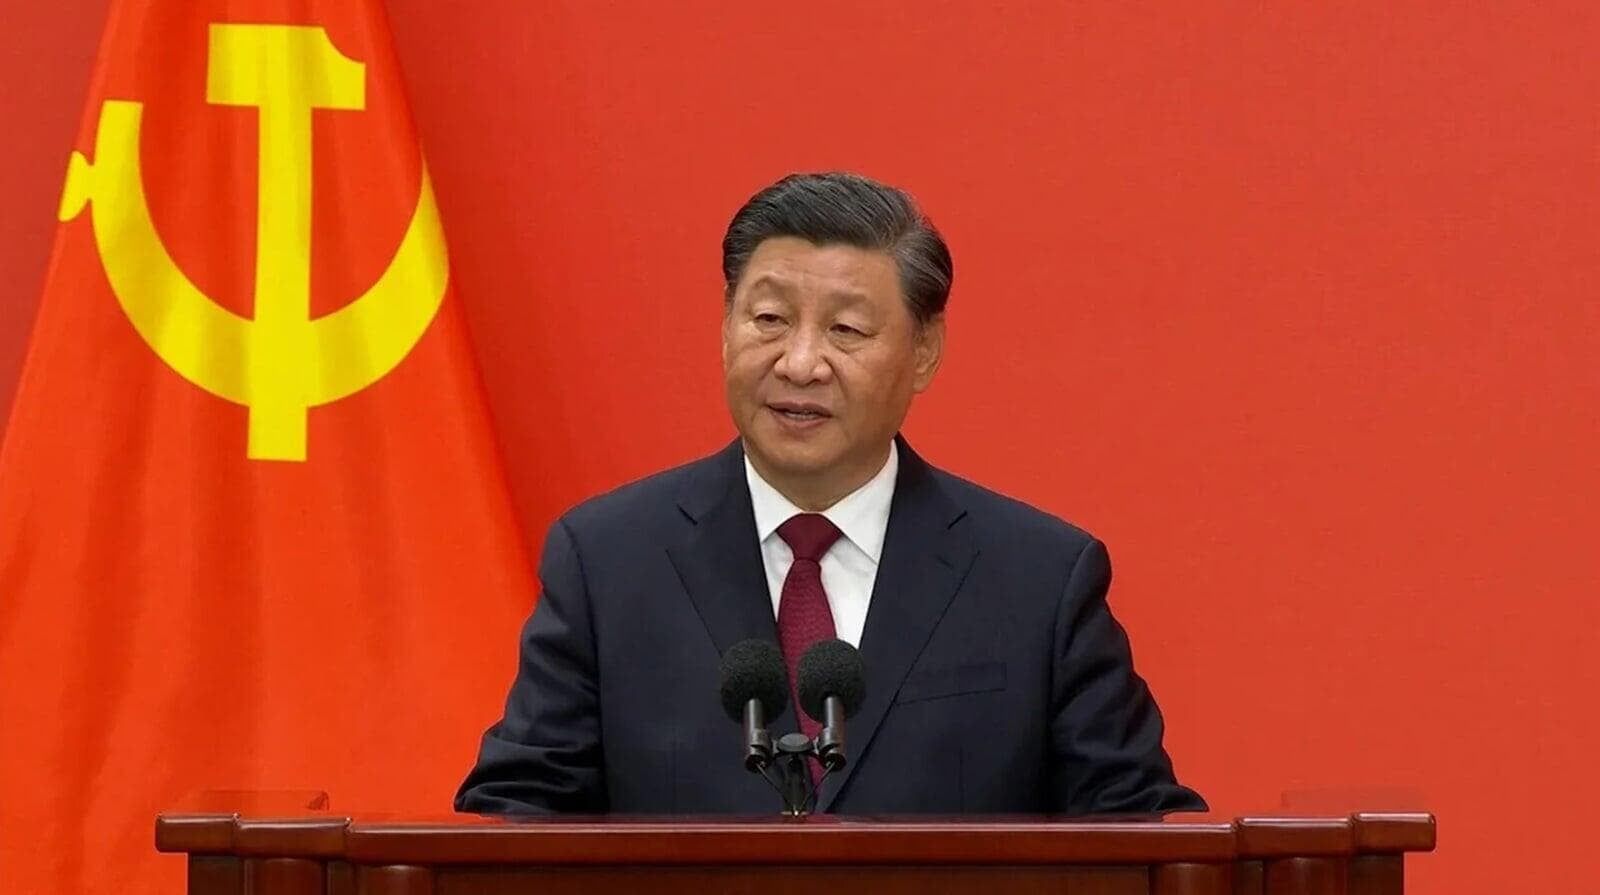
Xi Jinping, General Secretary of the Central Committee of the Communist Party of China, President of the People's Republic of China
A11.Patent grants by region, 2012 and 2022
Table 2
Number of grants |
Resident share (%) |
Share of world total (%) | Average growth (%) | ||||
Region | 2012 | 2022 | 2012 | 2022 | 2012 | 2022 | 2012–2022 |
Africa | 10,700 | 16,200 | 12.5 | 8.3 | 0.9 | 0.9 | 4.2 |
Asia | 649,000 | 1,226,700 | 72.4 | 79.3 | 57.0 | 67.3 | 6.6 |
Europe | 159,100 | 178,700 | 61.7 | 56.2 | 14.0 | 9.8 | 1.2 |
Latin America and the Caribbean | 20,200 | 41,500 | 5.6 | 9.1 | 1.8 | 2.3 | 7.5 |
North America | 275,000 | 341,500 | 44.9 | 42.1 | 24.2 | 18.7 | 2.2 |
Oceania | 24,000 | 18,600 | 6.9 | 6.2 | 2.1 | 1.0 | –2.5 |
World | 1,138,000 | 1,823,200 | 61.1 | 67.1 | 100.0 | 100.0 | 4.8 |
Table 2 shows the number of patents granted in the period from 2012 to 2022. As can be seen from this table, the number of patents received in Asia has almost doubled, while the increase in other regions is significantly lower. According to other indicators, Asia is also significantly ahead of other countries.
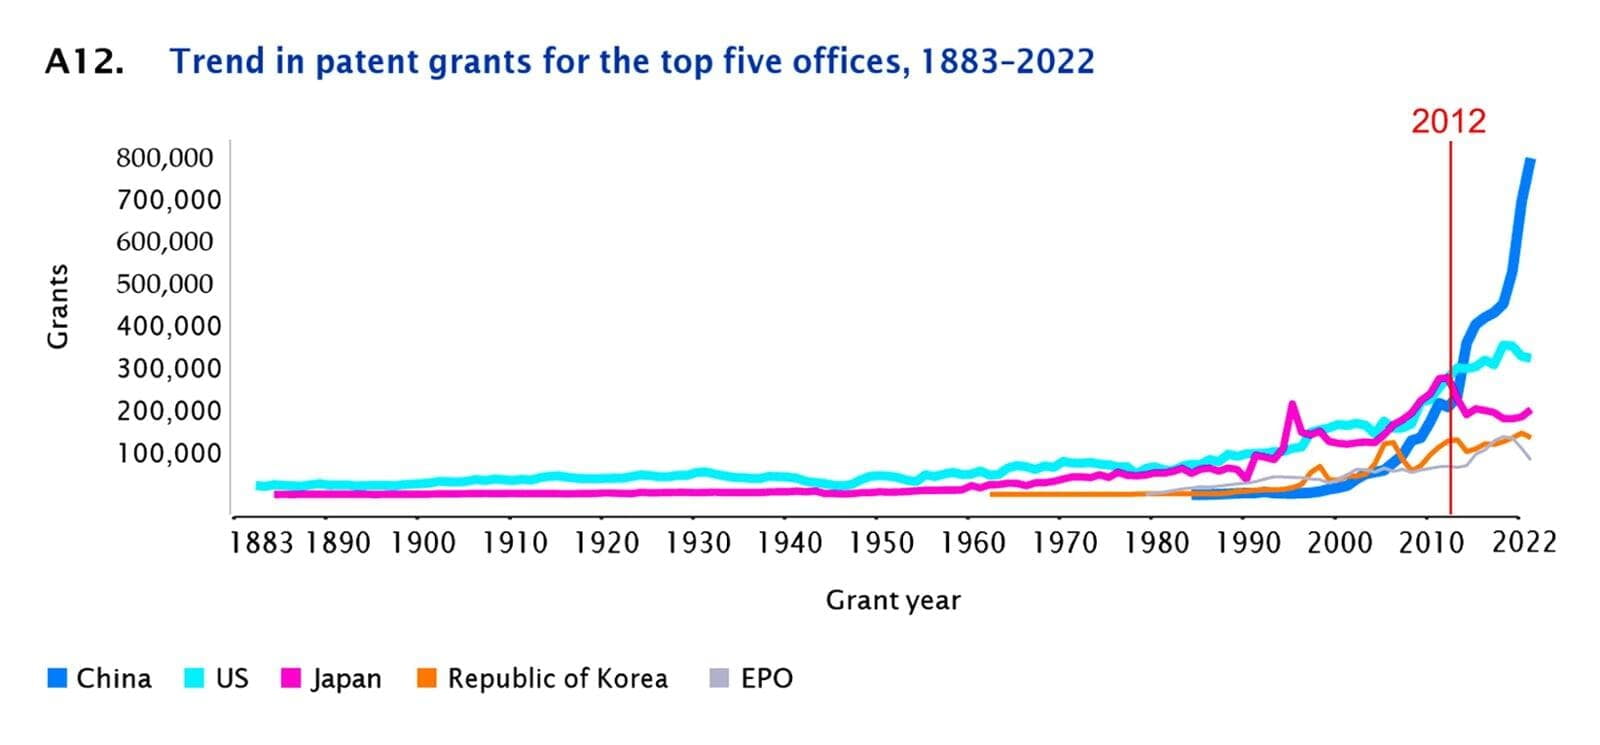
Fig.3.
Analyzing the trend of granted patents for Fig.3. We also highlighted the point in time from which the trend in the dynamics of patents granted in China has moved to exponential growth since the end of 2012. This confirms the earlier conclusion about the decisive role of the new strategy for the development of science, education and technology, put forward by the Chinese Communist Party at the XVIII CPC Congress.
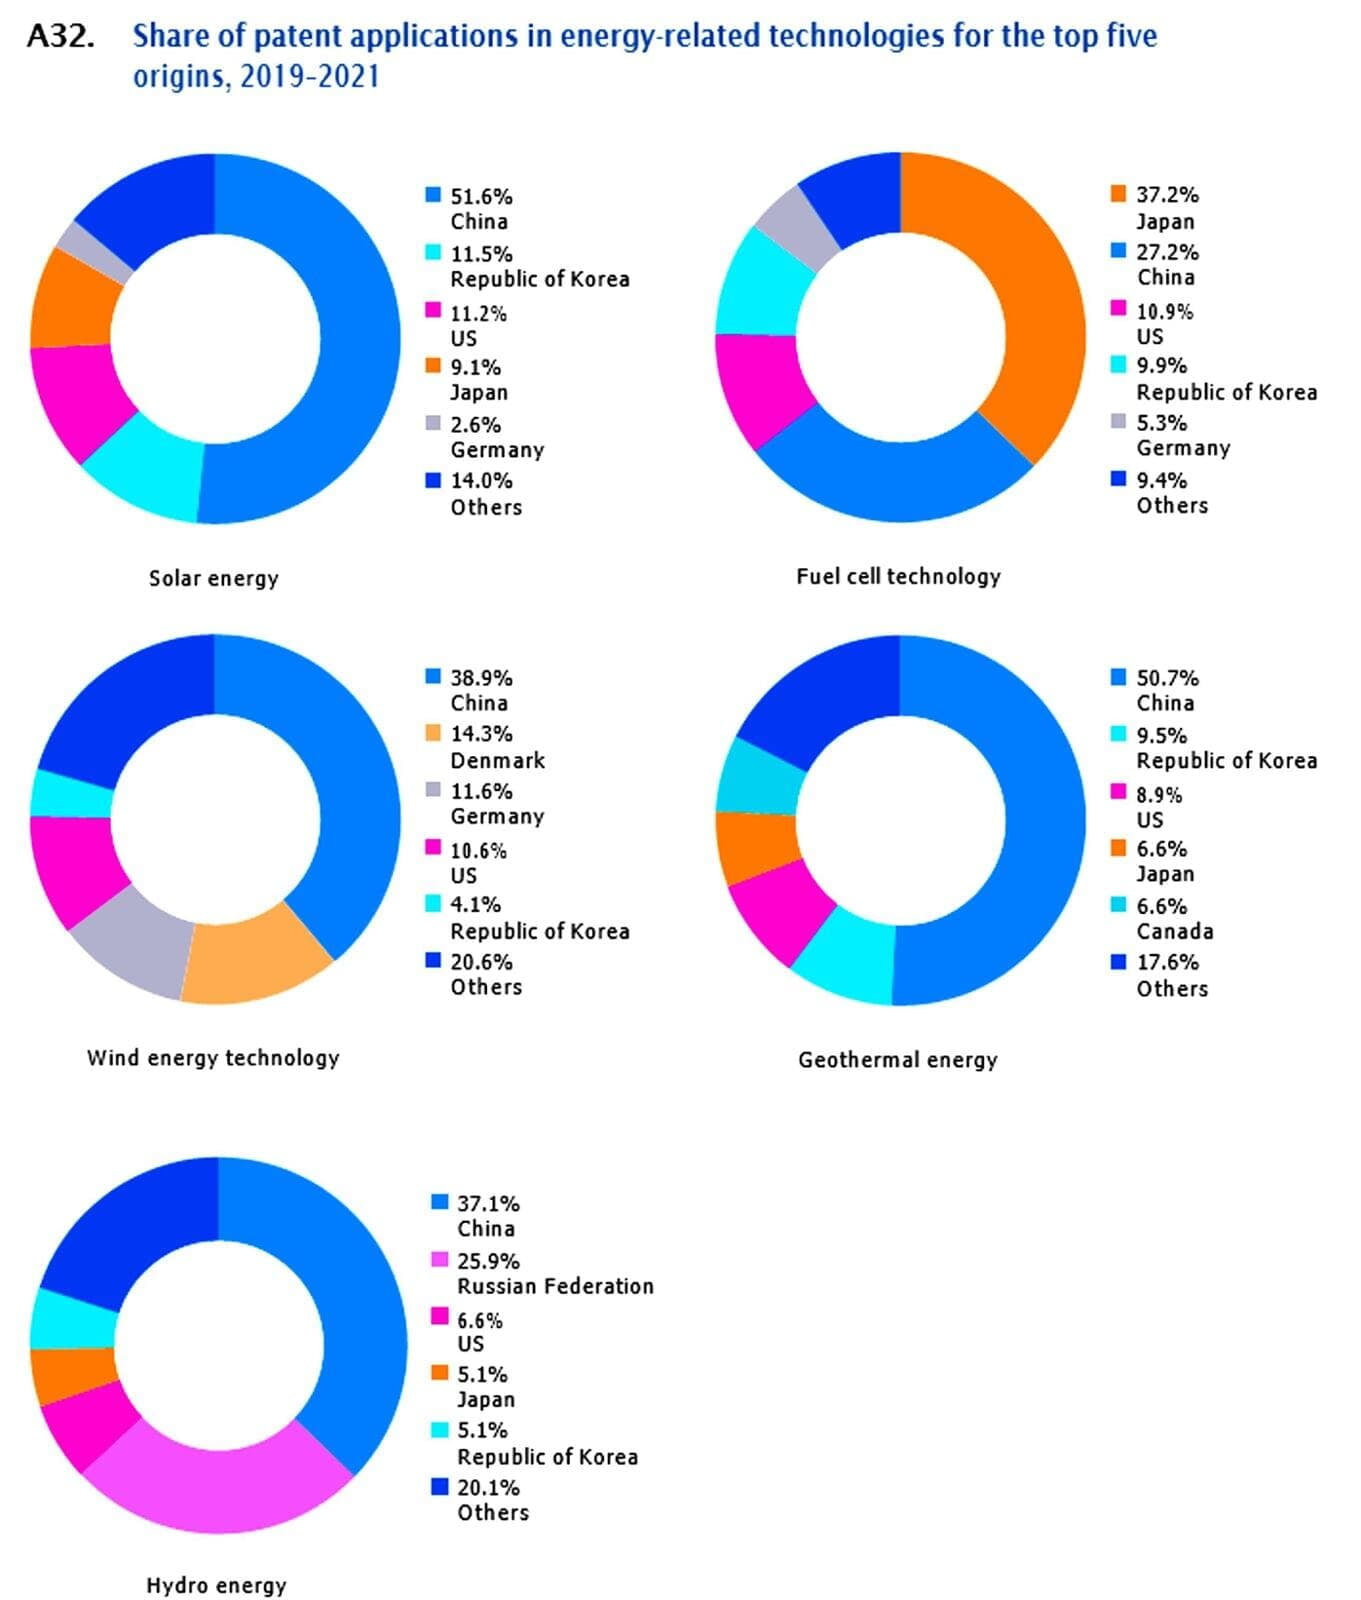
Fig.4.
Analyzing the diagrams in Fig.4. Showing the distribution of the number of patent applications in the period from 2019 to 2021, we see that China leads in four out of five types of energy. Only in the field of "Fuel cell technology" China is in second place, giving way to the first place to Japan.
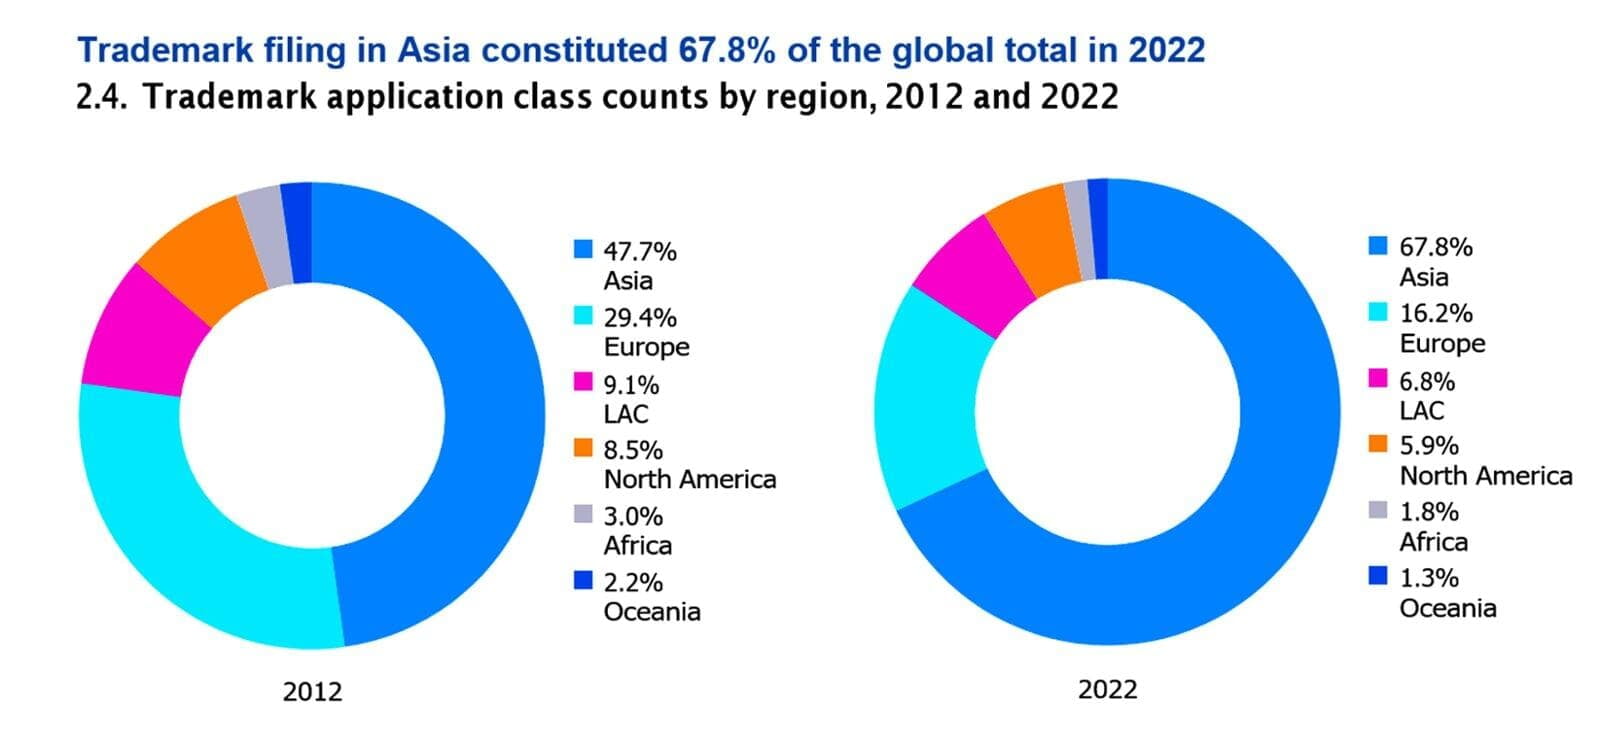
Fig.5.
Comparison of diagrams of Trademark filing in Fig.5. shows that from 2012 to 2022, Asia significantly outperformed other regions of the world, increasing the this indicator by 20.1% from 47.7% to 67.8%, while indicators for all other regions decreased significantly.
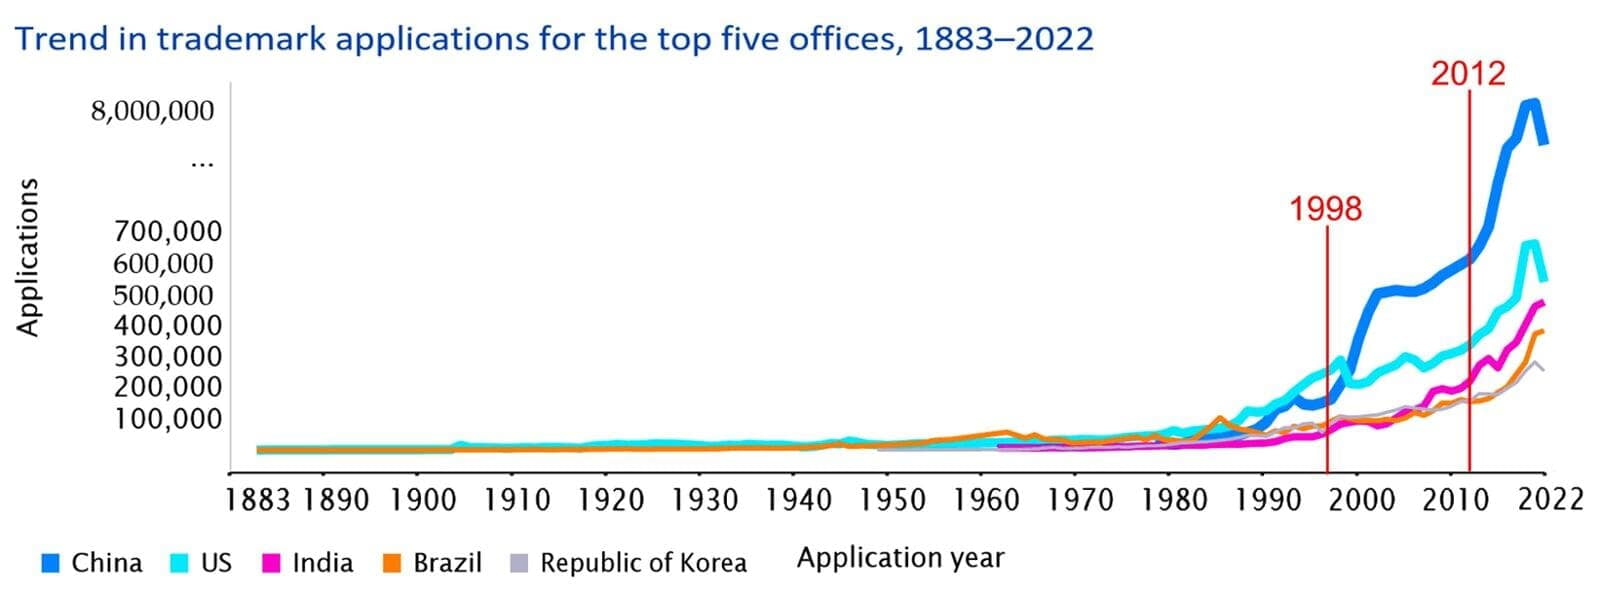
Fig.6.
It is very interesting to analyze the dynamics graph of Trademark filing in Fig.6.
It can be seen that there are two pronounced stages of sharp growth in the dynamics of the Trademark filing indicator. The first stage begins in 1998 immediately after the 15th CPC Congress in 1997. In our opinion, this fact can be explained by the increased development of industry in China, which is due to the decision taken at the 15th CPC Congress to initiate reform of the country's public sector.
This stage was completed in 2002, after which the growth dynamics of the Trademark filing indicator was very weak until 2012.
Meanwhile, since the end of 2012, the second stage of an even more significant increase in the Trademark filing indicator has begun, compared with the first stage. We associate this stage with the wise and balanced policy of the CPC adopted at the XVIII CPC Congress.
The observed period of decline in the Trademark filing indicator from 2020 to 2022, primarily in China and the United States, which are leaders in this indicator, is associated with the COVID-19 pandemic, which caused great damage to the economy and industry of all countries of the world.
CONCLUSIONS
- Thus, the analysis of Intellectual Property Protection Indicators (IPPI) showed that, in comparison with other regions of the world, since 2012, the IPPI of Asia has increased sharply.
- In the period from 2020 to 2022, there was a decrease in IPPI worldwide, which is associated with the COVID-19 pandemic, which caused great damage to the economy and industry of all countries of the world.
- China's share in the increase in Asia's IPPI is more than 90%.
- The main reason for the global growth of China's IPPI is the wise and farsighted policy of the General Secretary of the CPC Central Committee, Chinese President Xi Jinping.